Next-Generation Sequencing
Algorithms and analysis of massively parallel genomic sequencing
- Comprehensive assessment of RNA-seq (SEQC study)
- Systematic variation in RNA-seq (SEQC study)
- Impact of human genome annotation on RNA-seq
- Benchmarking RNA-seq quantification
- Next-generation sequencing for cardiovascular diseases
- Impact of RNA-seq aligners on downstream inferences
Comprehensive Assessment of RNA-seq (SEQC study)
The Bio-MIBLab, as part of the Sequencing Quality Control (SEQC) consortium coordinated by the US Food and Drug Administration, contributed to a comprehensive assessment of RNA-seq technology. The consortium examined Illumina HiSeq, Life Technologies SOLiD and Roche 454 platforms at multiple laboratory sites using reference RNA samples with built-in controls, they assessed RNA sequencing (RNA-seq) performance for sequence discovery and differential expression profiling and compareed it to microarray and quantitative PCR (qPCR) data using complementary metrics. At all sequencing depths, they discovered un-annotated exon-exon junctions, with over 80% validated by qPCR. They found that measurements of relative expression were accurate and reproducible across sites and platforms if specific filters were used. In contrast, RNA-seq and microarrays did not provide accurate absolute measurements, and gene-specific biases were observed for all examined platforms, including qPCR. Measurement performance depended on the platform and data analysis pipeline, and variation was large for transcript-level profiling. The complete 7 SEQC data sets, comprising over 100 billion reads (10Tb), provide unique resources for evaluating RNA-seq analyses for clinical and regulatory settings.
Systematic variation in RNA-seq (SEQC study)
High-throughput RNA sequencing (RNA-seq) facilitates comprehensive scans of entire transcriptomes, but best practices have not been fully defined for the increasingly necessary analyses of RNA-seq data collected with multiple sequencing platforms or at multiple sites. Here we used standardized RNA samples with built-in controls to examine sources of error in large-scale RNA-seq studies and their impact on the detection of differentially expressed genes (DEGs). Variations in guanine-cytosine content, gene coverage, sequencing error rate and insert size could identify samples with increased false positives and lower inter-site DEG reproducibility. Moreover, commonly used methods (cqn, EDASeq, RUV2, sva, PEER) varied in their ability to remove these systematic biases, with performance ranging from improvements of DEG detection to unintended, increased false positives, depending on sample complexity and initial data quality. Normalization methods that combine data from genes across sites are strongly recommended for identifying and removing site-specific effects, and can dramatically improve RNA-seq studies.
Assessing the Impact of Human Genome Annotation Choice on RNA-Seq Expression Estimation
Genome annotation is a crucial component of RNA-seq data analysis. Much effort has been devoted to producing an accurate and rational annotation of the human genome. An annotated genome provides a comprehensive catalogue of genomic functional elements. Currently, at least six human genome annotations are publicly available, including AceView Genes, Ensembl Genes, H-InvDB Genes, RefSeq Genes, UCSC Known Genes, and Vega Genes. Characteristics of these annotations differ because of variations in annotation strategies and information sources. When performing RNA-seq data analysis, researchers need to choose a genome annotation. However, the effect of genome annotation choice on downstream RNA-seq expression estimates is still unclear. This study (1) investigates the effect of different genome annotations on RNA-seq quantification and (2) provides guidelines for choosing a genome annotation based on research focus.
We define the complexity of human genome annotations in terms of the number of genes, isoforms, and exons. This definition facilitates an investigation of potential relationships between complexity and variations in RNA-seq quantification. We apply several evaluation metrics to demonstrate the impact of genome annotation choice on RNA-seq expression estimates. In the mapping stage, the least complex genome annotation, RefSeq Genes, appears to have the highest percentage of uniquely mapped short sequence reads. In the quantification stage, RefSeq Genes results in the most stable expression estimates in terms of the average coefficient of variation over all genes. Stable expression estimates in the quantification stage translate to accurate statistics for detecting differentially expressed genes. We observe that RefSeq Genes produces the most accurate fold-change measures with respect to a ground truth of RT-qPCR gene expression estimates.
Based on the observed variations in the mapping, quantification, and differential expression calling stages, we demonstrate that the selection of human genome annotation results in different gene expression estimates. When conducting research that emphasizes reproducible and robust gene expression estimates, a less complex genome annotation may be preferred. However, simpler genome annotations may limit opportunities for identifying or characterizing novel transcriptional or regulatory mechanisms. When conducting research that aims to be more exploratory, a more complex genome annotation may be preferred.
Experimental Design for Assessing RNA-Seq Quantification Strategies in Replication Studies
One way to gain a more comprehensive picture of the complex function of a cell is to study the transcriptome. A promising technology for studying the transcriptome is RNA sequencing, an application of which is to quantify elements in the transcriptome and to link quantitative observations to biology. Although numerous quantification algorithms are publicly available, no method of systematically assessing these algorithms has been developed. To meet the need for such an assessment, we present an approach that includes (1) simulated and real datasets, (2) three alignment strategies, and (3) six quantification algorithms. Examining the normalized root-mean-square error, the percentage error of the coefficient of variation, and the distribution of the coefficient of variation, we found that quantification algorithms with the input of sequence alignment reported in the transcriptomic coordinate usually performed better in terms of the multiple metrics proposed in this study.
Chandramohan R, Wu PY, Phan JH and Wang MD. “Systematic assessment of RNA-seq quantification tools using simulated sequence data.”ACM Conference on Bioinformatics, Computational Biology and Biomedicine, ACM-BCB. Washington, DC, USA. 2013 Sep 22; 623-32.
Chandramohan R, Wu PY, Phan JH, and Wang MD. “Benchmarking RNA-Seq quantification tools.” Conf Proc IEEE Eng Med Biol Soc, EMBC. Osaka, Japan. 2013 Jul 3; 647-50.
Next-Generation Sequencing for Cardiovascular Diseases
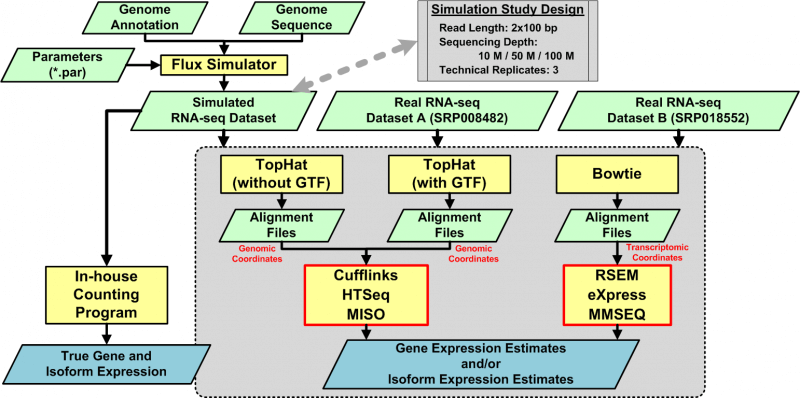
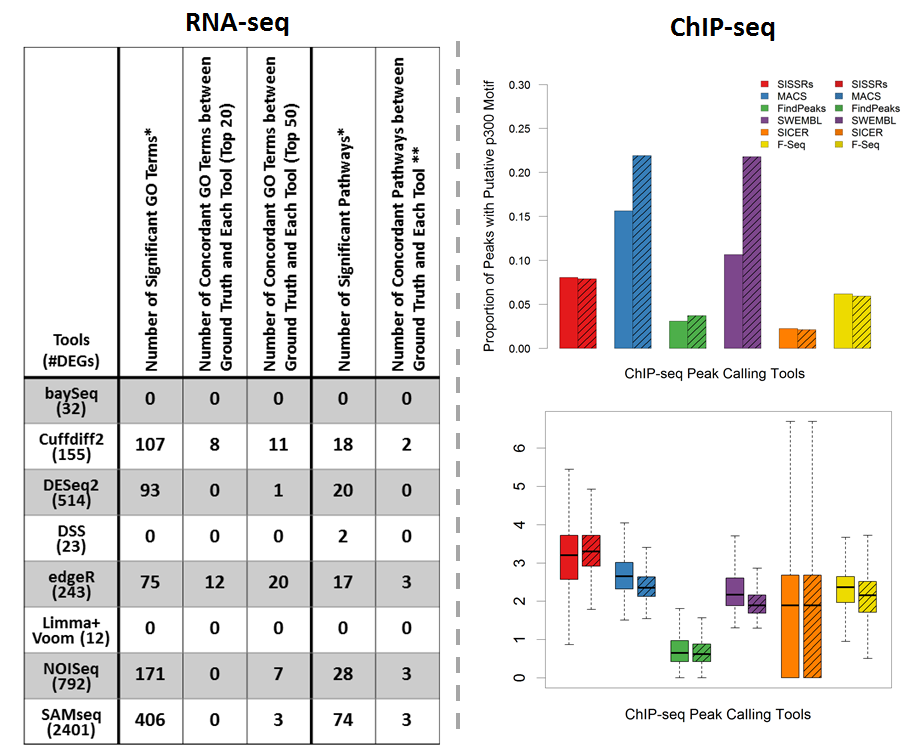
Next-generation sequencing (NGS) and associated bioinformatics methods have been applied to cardiovascular genomics, transcriptomics, and epigenomics for identifying and quantifying omic biomarkers that may be clinically viable for early cardiovascular disease (CVD) diagnosis and effective CVD treatment and management. We studied the utility of NGS bioinformatics for cardiovascular research by applying RNA-seq and ChIP-seq pipelines to publicly available RNA-seq and ChIP-seq datasets, respectively. The bioinformatics pipeline for identifying DEGs using RNA-seq data includes sequence mapping, expression quantification, expression normalization, and DEG detection. We evaluated eight bioinformatics pipelines that identify DEGs as potential CVD biomarkers by functional and quantitative assessments. In summary, edgeR and Cufflinks yielded the most functionally relevant DEGs. Nonparametric methods, NOISeq and SAMseq, identified many more DEGs than other tools; however, a large proportion of these DEGs may be less reliable (e.g., DEGs with limited read counts) and irrelevant to the biology of the original study. The bioinformatics pipeline for identifying genome-wide protein-binding regions using ChIP-seq includes sequence mapping and peak calling. We evaluated six bioinformatics pipelines that identify peaks as potential CVD biomarkers. Through quantitative analysis, MACS was able to identify peak regions (i.e., candidate enhancer locations) with the highest motif discovery rate, the highest tag coverage, and reasonable average peak length. In contrast, SICER identified peaks with only limited tag coverage and a low motif discovery rate.
Phan JH, Quo CF, and Wang MD. “Cardiovascular genomics: a biomarker identification pipeline.” IEEE Trans Inf Technol Biomed. 2012 Sep; 16(5): 809-22.
The Impact of RNA-seq Aligners on DEG and Gene Expression Estimation
Differential expression analysis is one of the most important applications of RNA-seq. A typical RNA-seq analysis pipeline includes four steps, namely (1) sequence read alignment, (2) expression quantification, (3) expression normalization, (4) differentially expressed gene (DEG) detection. For each step of this pipeline, many algorithms or tools have been developed. While numerous tools are available, research has shown that the choice of pipeline influences the results of DEG detection and gene expression estimation.
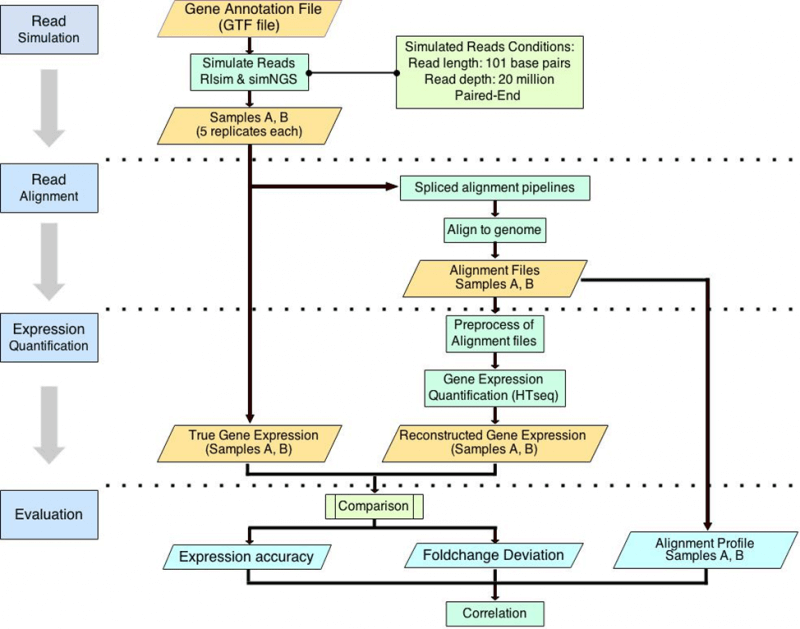
Reads alignment is the first step of DEG detection and gene expression estimation. However, the impact of aligners on gene expression estimation remains unclear. To address this issue, we constructed nine pipelines consisting of nine different spliced aligners with the same quantification, normalization, and DEG detection tools.
With the SEQC dataset (Universal Human Reference RNA and Human Brain Reference RNA), we compared the number of DEGs detected by nine pipelines. We found moderate linear correlation between the number of DEGs detected and the percentage of reads aligned with zero mismatch.
With simulated reads as ground truths, we further introduced three alignment performance metrics, (1) the percentage of reads aligned, (2) the percentage of reads aligned with zero mismatch, and (3) the percentage of reads aligned with at most one mismatch. We also evaluated the impact of alignment performance on gene expression estimation using three metrics, (1) gene detection accuracy, (2) the number of genes falsely quantified, (3) the number of genes with falsely estimated fold changes. We found that among various pipelines, the quality of alignment and the accuracy of gene expression estimation are linearly correlated. And based on the correlations, we proposed that the percentage of reads aligned and the percentage of reads aligned with zero mismatch may be used to assess the performance of gene expression estimation for all RNA-seq datasets.
Yang C, Wu PY, Tong L, Phan JH, and Wang MD. “The impact of RNA-seq aligners on gene expression estimation.” ACM Conference on Bioinformatics, Computational Biology and Biomedicine, ACM-BCB. Atlanta, GA, USA. 2015 Sep 9; accepted.